Vizualisation
Information Visualization is the study of (interactive) visual representations of abstract data to reinforce human cognition.
The abstract data include both numerical and non-numerical data, such as text and geographic information.
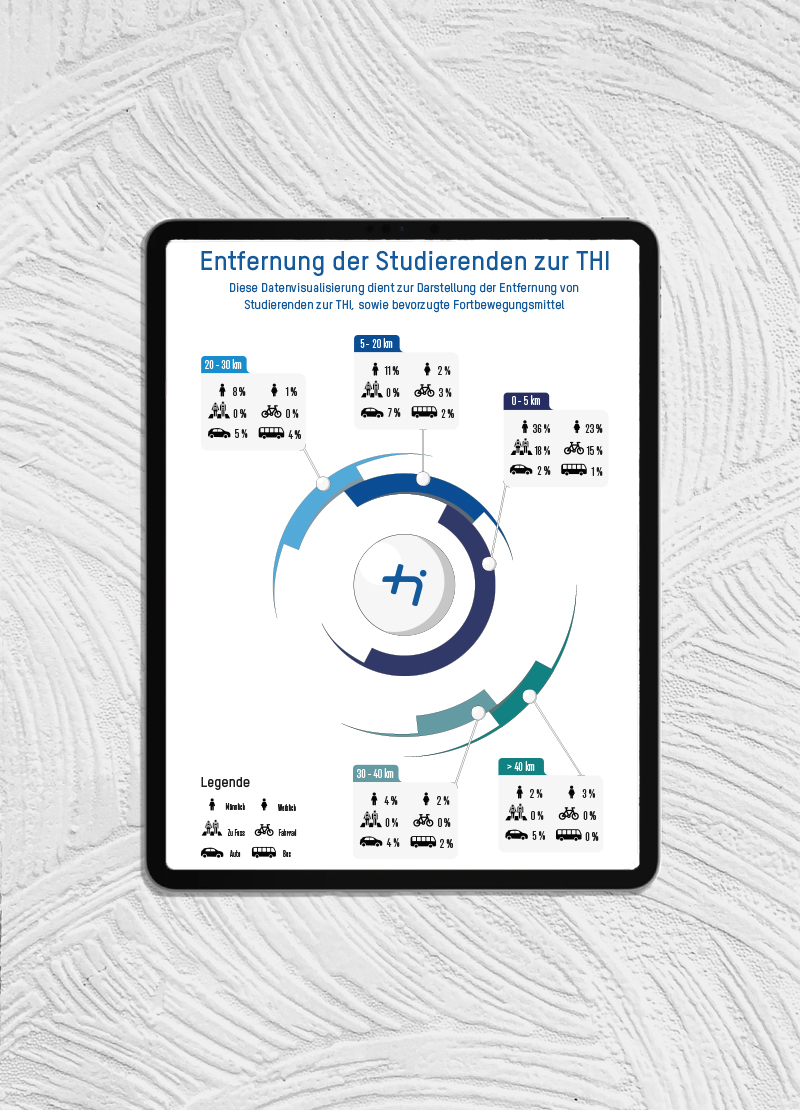
The goal of the project "Distance of students to THI" was an interesting and visually appealing data visualization with categories such as gender of respondents, means of transportation
(by foot, bicycle, bus, train or car) and place of residence with distance.